Baseline Assessment - Part Two
Y7 Sparx Maths Baseline Assessment - National results and insights
Do you want data-driven insights into the knowledge of Year 7 students nationally at the start of their secondary school journey? If yes, then read on!
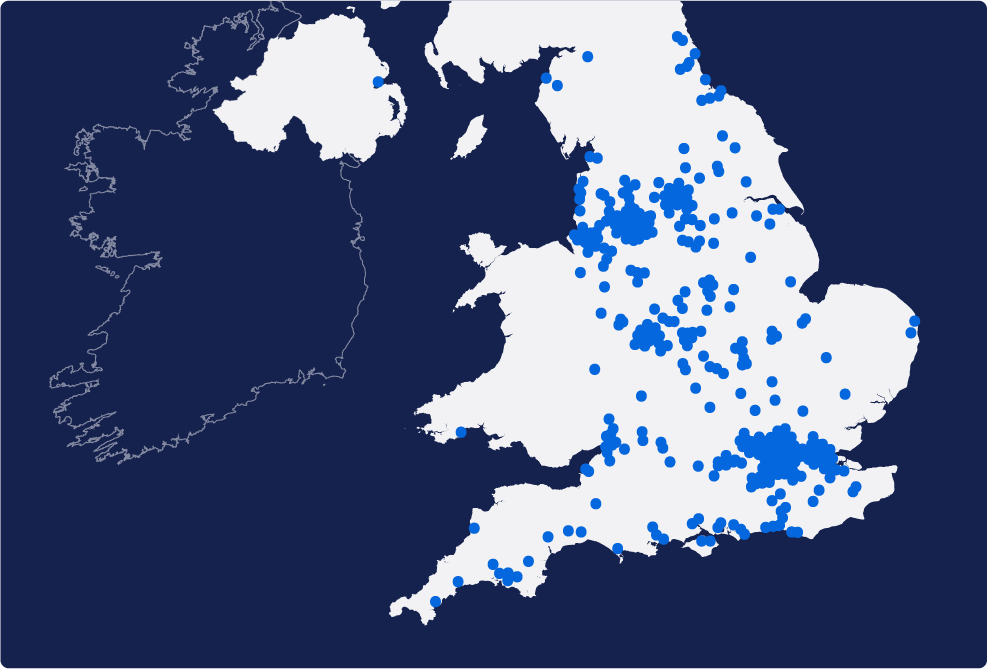
In September 2023, approximately 60,000 students from 400 Sparx Maths schools across the country sat the Year 7 Sparx baseline assessment and used the accompanying QLA and bespoke follow-up work.
In this blog, we’ll delve into the findings from this assessment, highlight key takeaways and suggest how they could help with teaching in the initial phase of Year 7. We’ll also take a brief look at some of the amazing follow-up work available to students and teachers who used the assessment, and explain how you can get involved next year.
What was the aim of the assessment?
The main aim of the Year 7 Sparx baseline assessment was to help teachers identify and close gaps in their students’ knowledge from Key Stage 2. Teachers could then use this insight, and the supporting follow-up work, to help students build the secure toolkit of skills required for further teaching in Year 7 and beyond.
We designed the assessment to cover the following key units, which we feel underpin many other areas of maths and are important prerequisites for the topics generally covered in Year 7 schemes of learning:
- Place Value
- Rounding
- Adding
- Subtracting
- Multiplying
- Dividing
- Negative Numbers
- Area & Perimeter
- Fractions
- Prime Numbers & Factors
With almost 400 schools sitting the assessment and inputting their data into the QLA, we were able to provide each school with a comparison of how their school performed compared to the national average, and more specifically how they performed in each unit and on each question. This allowed schools to identify their relative strengths and weaknesses, in turn informing teaching and guiding focussed CPD.
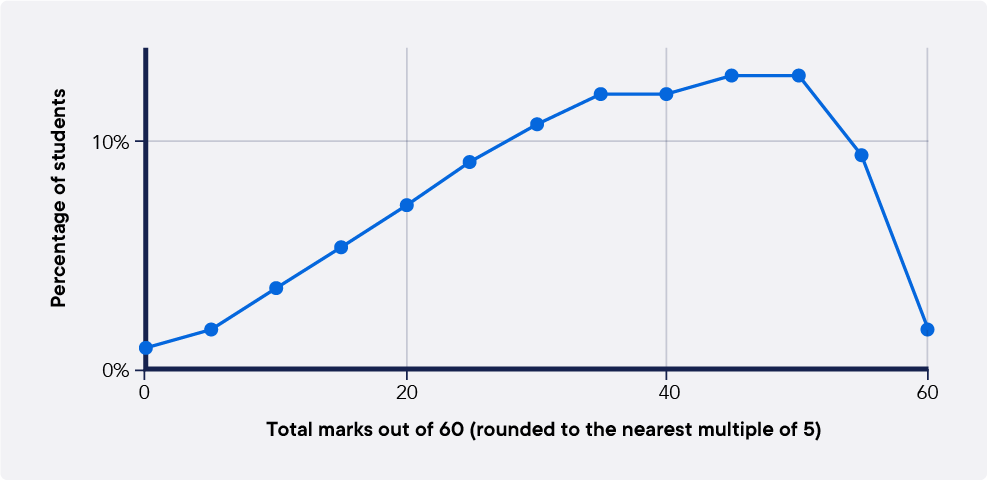
At a national level, there were many interesting insights. The national average mark was 35.78 out of 60, and the distribution of marks can be seen in the graph below.
However, the most interesting insights come when we delve into performance across the different areas of maths and across particular questions.
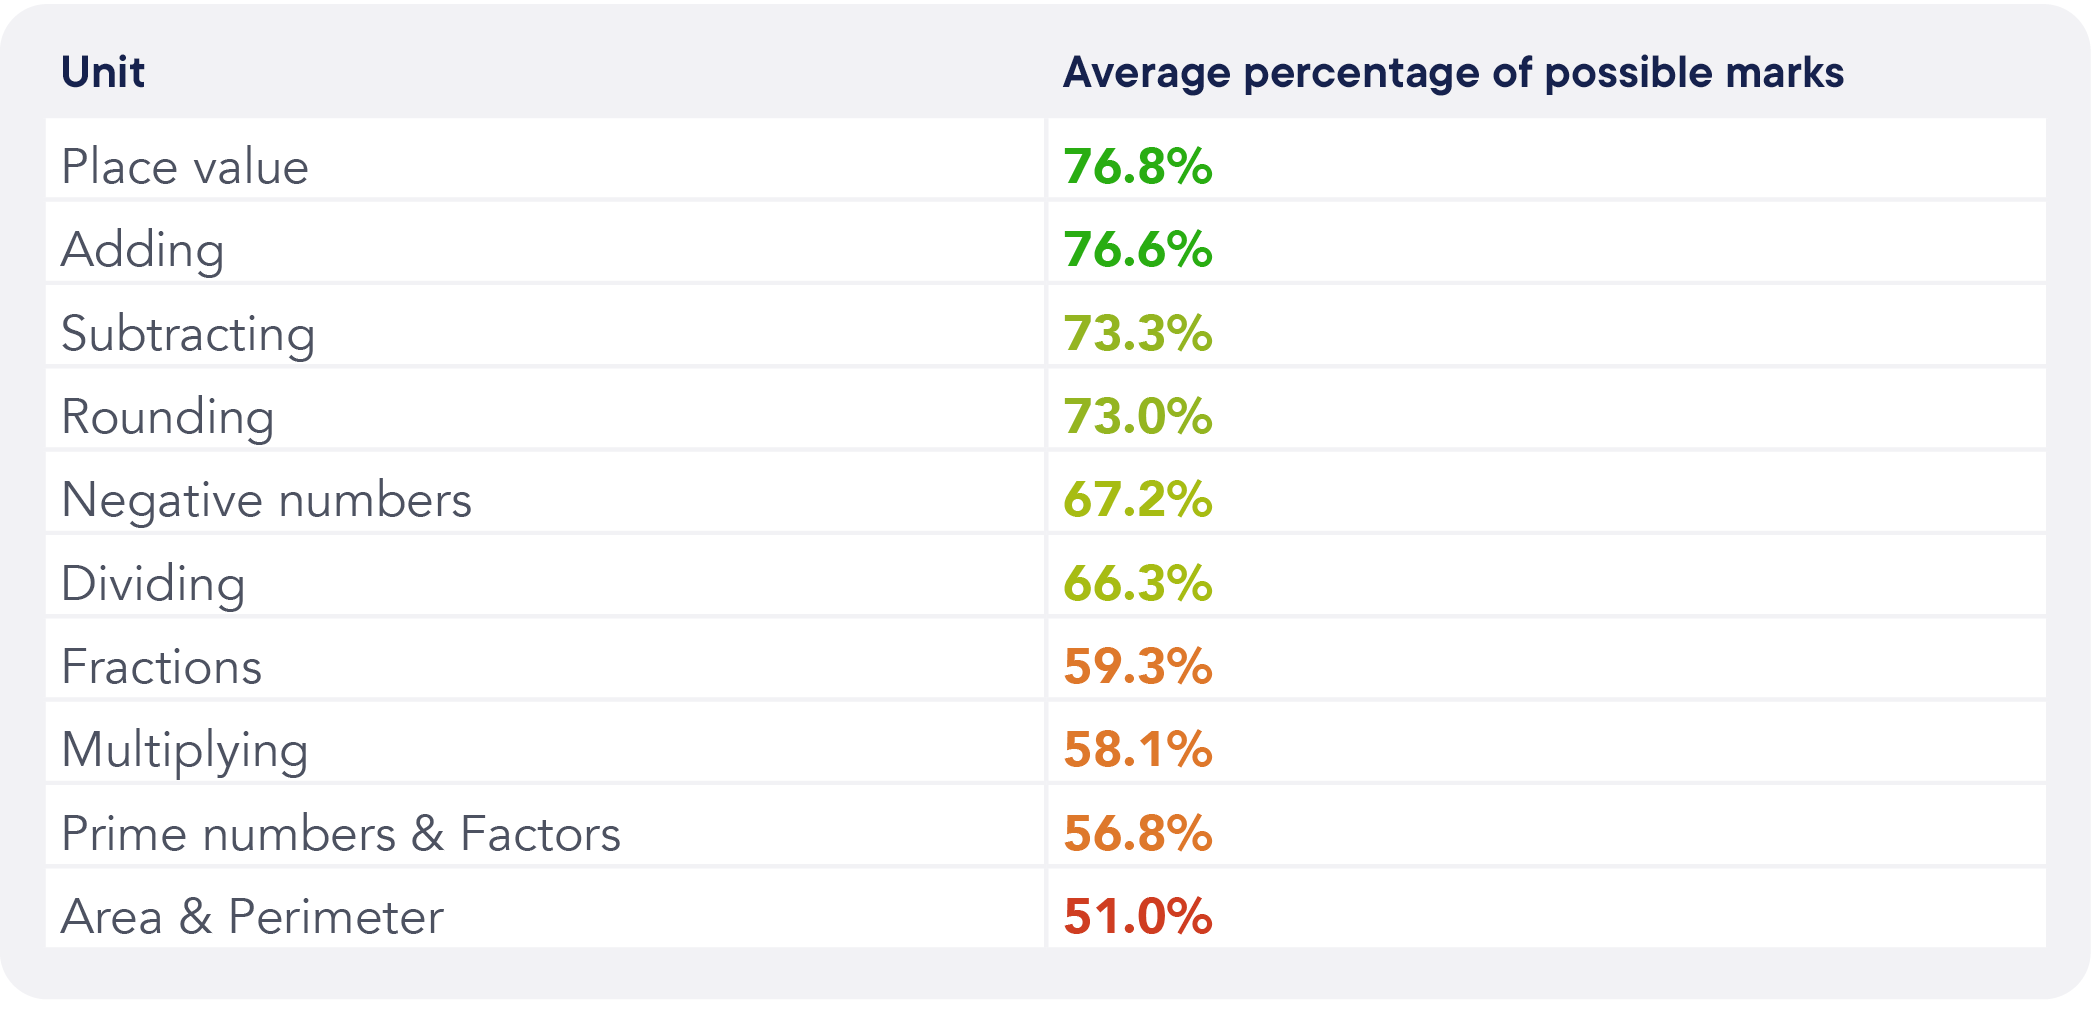
Looking first at the unit level, we can see that performance was quite varied across the different areas of maths.
High performing units and questions
It is reassuring that most students performed well at core number concepts such as place value, adding and subtracting, but these results suggest that further time may need to be dedicated to other areas of number, such as multiplying and fractions.
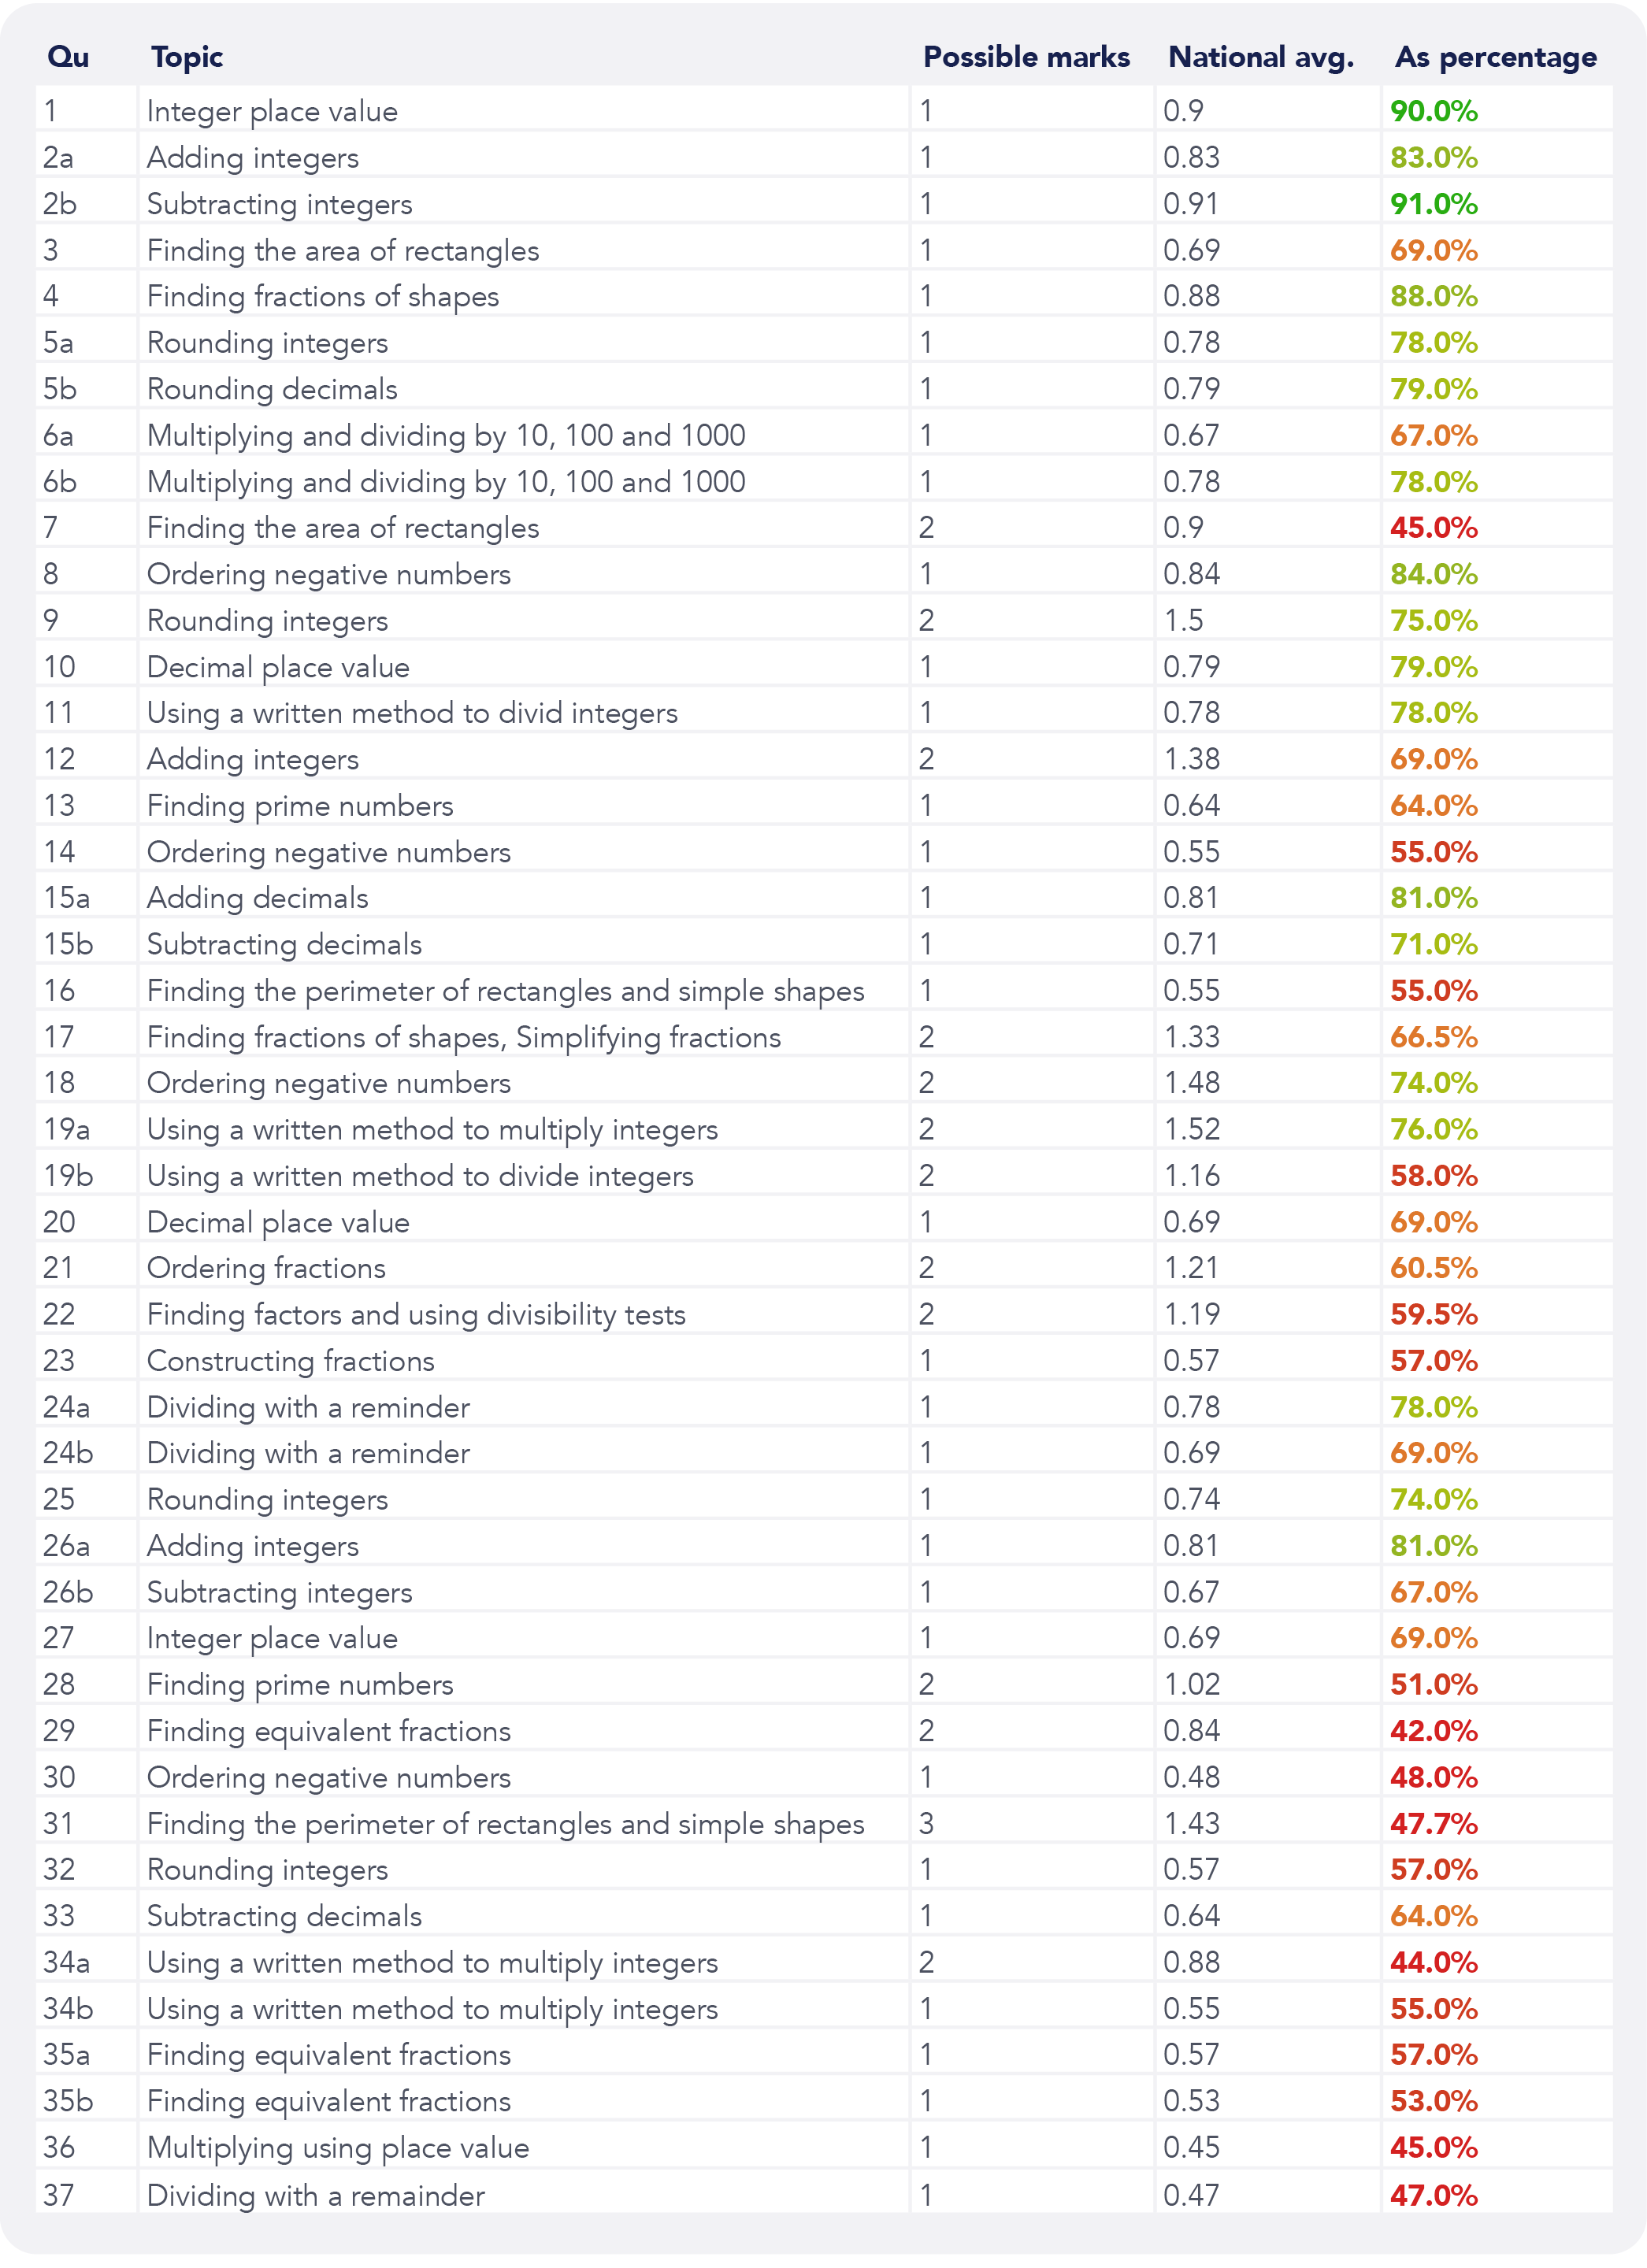
At a question level analysis, four of the top seven best answered questions were on adding and subtracting. Interestingly, students performed well on problem solving questions on these topics, such as finding missing digits in a given column method. This question is not necessarily a straightforward problem to solve, but students got an average of 0.81 marks out of 1, indicating that students have confidence in this area.
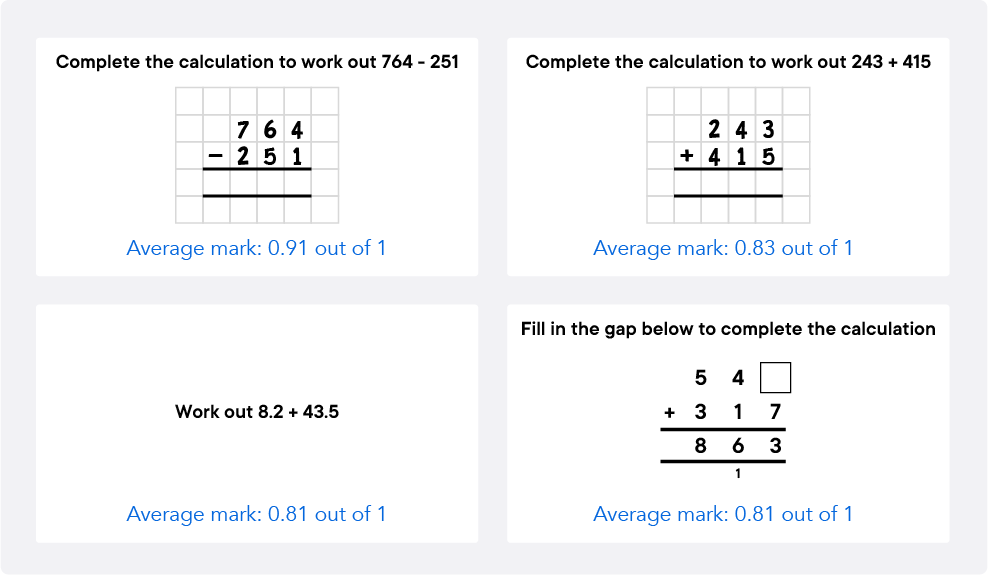
However, from the questions shown above we found it surprising to see that students performed better on the subtraction question than they did on the addition question. Typically we’d expect to see the opposite result, with students being more fluent at adding. Could it be that students were paying more attention to the harder question on subtraction and therefore were at a lower risk of making a mistake?
Low performing units and questions
Looking more deeply at the individual questions asked in the assessment, many of the questions that were answered less well appeared later in the paper, but a few stood out earlier on, particularly those on area and perimeter.
It’s clear that this area of maths really challenged students, suggesting that time should be given to recap concepts taught at Key Stage 2, such as finding the area and perimeter of a rectangle, before introducing new concepts in Key Stage 3.
Question 7, about the area of a square, was one of the questions with the lowest average performance, with the mean mark being 0.9 out of 2.

Initially we thought that students may have been getting confused due to the shape being a square and only one side being given, rather than the rectangles students may be more used to seeing. However, from looking at the data from Sparx Maths Homework where this question has been attempted over 154,000 times, we believe there may be a more prominent misconception. The most common incorrect answer is 20cm², which is likely to have been reached by students who are finding the perimeter rather than the area of the square.
We also looked into the data on Question 3, which asked students to find the area of a rectangle. Again, students performed less well than expected on this question.

In Sparx Maths Homework, this question has been attempted 260,000 times and the most common incorrect answer given by students is 10cm², which we can assume has been reached by finding the perimeter. The second most common incorrect answer was 5cm² which we believe is reached by adding together the two given side lengths.
The data from the assessment and Sparx Maths Homework strongly suggests that students are confusing area and perimeter and do not have a deep understanding of these concepts, meaning that students are likely carrying deep-rooted misconceptions into their secondary maths journey.
Another question that caught our attention was Question 31, finding the perimeter of a compound shape.

In Sparx Maths Homework, this question has been attempted 123,000 times and the most common incorrect answer is 23cm, indicating students may have overlooked one of the 5cm lengths. But which one? Further analysis into our shadow questions revealed that finding the missing length by subtraction was the most common difficulty experienced by our students. This is helpful information to have when teaching this topic as particular emphasis can be placed on combatting this challenge.
The other questions which were answered least successfully were from a range of topics in the later part of the paper, as expected. We designed the assessment in such a way that all students could achieve some successes, but also in a way that even the highest attainers had a level of challenge.
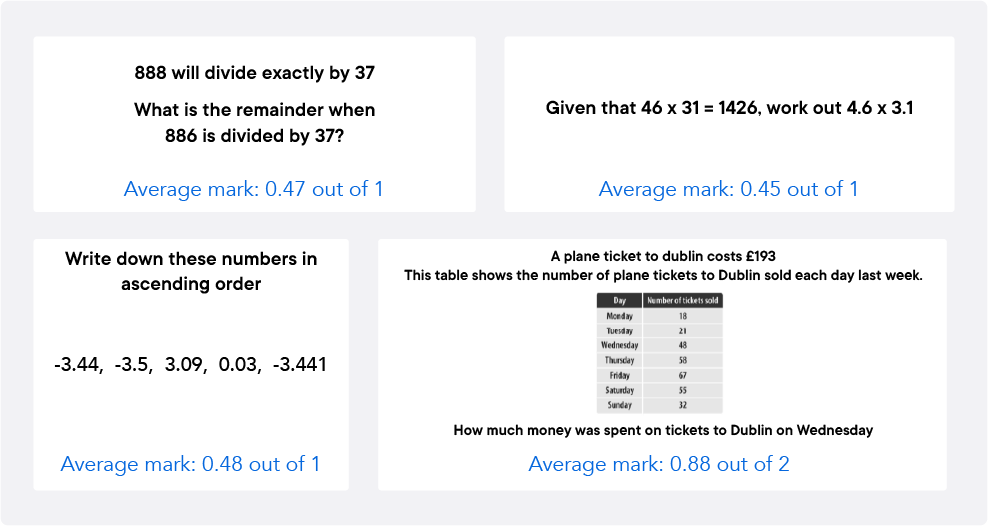
The question with the worst performance was Question 29 on finding equivalent fractions. Although it’s a problem solving question, the low performance still surprised us.

However, when we dug into the Sparx Maths Homework data of over 205,000 responses, we could see that students are quite successful at finding the denominator of the middle fraction. The issues arise with finding the numerator in the final fraction. The two most common incorrect numerators given were 6 and 12, both likely reached by multiplying the numerator of the middle fraction, 3, rather than the numerator of ⅕, showing that the unusual layout has a significant impact on student confidence with using an otherwise familiar method.
For a detailed breakdown of the national performance data by question, please see the appendix to this blog.
Turning data into action
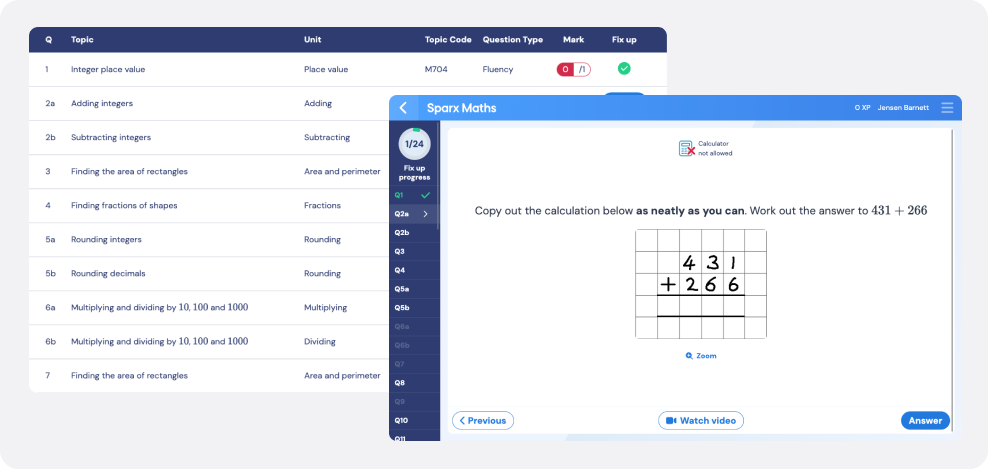
In addition to the national comparison report, we also provided Sparx Maths Homework schools who used the baseline assessment QLA with access to a brand new feature, Fix-up work.
This new feature provides practice to every student focussing on the fluency questions they didn’t get correct in the assessment. By providing every student with a bespoke task of shadow questions, complete with support videos, students can quickly revisit the assessment and fix-up key questions.
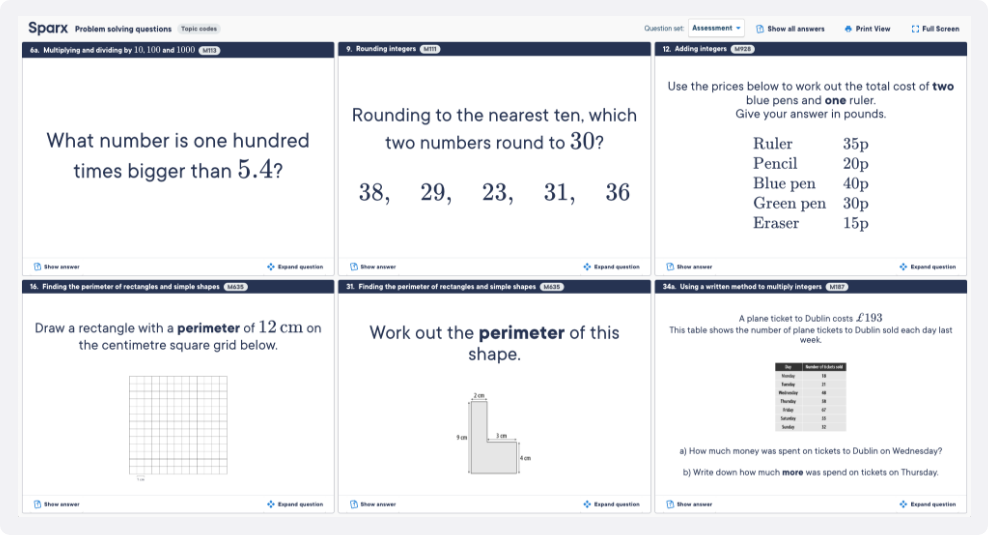
For teachers, the insights page gives an opportunity to dig into the problem solving questions that students found particularly challenging. This is a great way to provide whole class feedback and to engage the class in what can typically be a challenging lesson to deliver!
What’s next?
In conclusion, the Year 7 Sparx baseline assessment isn’t just a test; it’s a dynamic tool that empowers teachers and ensures students are well-prepared for the mathematical journey ahead. By embracing the insights it offers, schools can guide students toward mathematical success.
If you didn’t get a chance to be involved this year (and even if you did!) we’d love for you to be involved next year. But, if you don’t want to wait until September 2024 to get these data-driven insights into your students’ performance then read on.
For the current (2023/24) academic year, we have designed termly assessments to accompany the Sparx Maths Curriculum. For Years 7 to 9 these assessments are supported by a revision programme for students, involving fluency questions for each unit studied, as well as opportunities to practise problem-solving questions. After the assessment, QLAs and fix-up work will be available. For Year 7, we will also be providing reports.
For the next (2024/25) academic year, we plan to make assessments, revision, follow-up work and reporting available for all year groups.
Appendix:
National question performance
